
How’s the Rother doing?
The Western Sussex Rivers Trust (WSRT) has recently been sharing some analysis of the 2026 data from the River Guardians Water Testing programme which we thought would interest our members so here is an outline of some of those findings.
WSRT state on their website that they are, “a team striving to protect and restore resilient, vibrant riverscapes for wild life and people. From the bold sweeping Arun in the east to the precious Ems in the west”. Elsewhere on their website they describe the River Guardians programme in the following terms:
“Since January 2024, WSRT River Guardians and volunteers have conducted 1600+ River Health Surveys using standardised testing kits measuring:
Phosphates
Turbidity (murkiness of the water)
Total Dissolved Solids (TDS)
Nitrates
Temperature
Surveys also include observations of river characteristics, pollution, and ecosystems. Training ensures consistent, scientifically valid methods, while collaboration with existing groups unifies monitoring efforts.” Several Eco Rother Action members have been WSRT River Guardians since the programme’s inception, but just what are all these surveys telling us?
Phosphates come predominantly from sewage, but can also be added to from agrichemicals, or from faecal matter from wild, domestic or farm animals; nitrates come predominantly from agrichemicals but can also be added to from sewage. Some Wastewater Treatment Works (WTW) are required by the terms of their ‘Permits to Discharge’, to ferric dose the effluent to reduce phosphorous levels, which lead to phosphates in the river, but such a requirement is not part of the majority of local WTWs’ Permits.
The image below shows all the testing sites on the Rother and its tributaries and the 3 areas of the Rother, Upper, Mid and Lower, that WSRT use when analysing the results. Volunteer River Guardians do their best to survey each site once a month throughout the year.
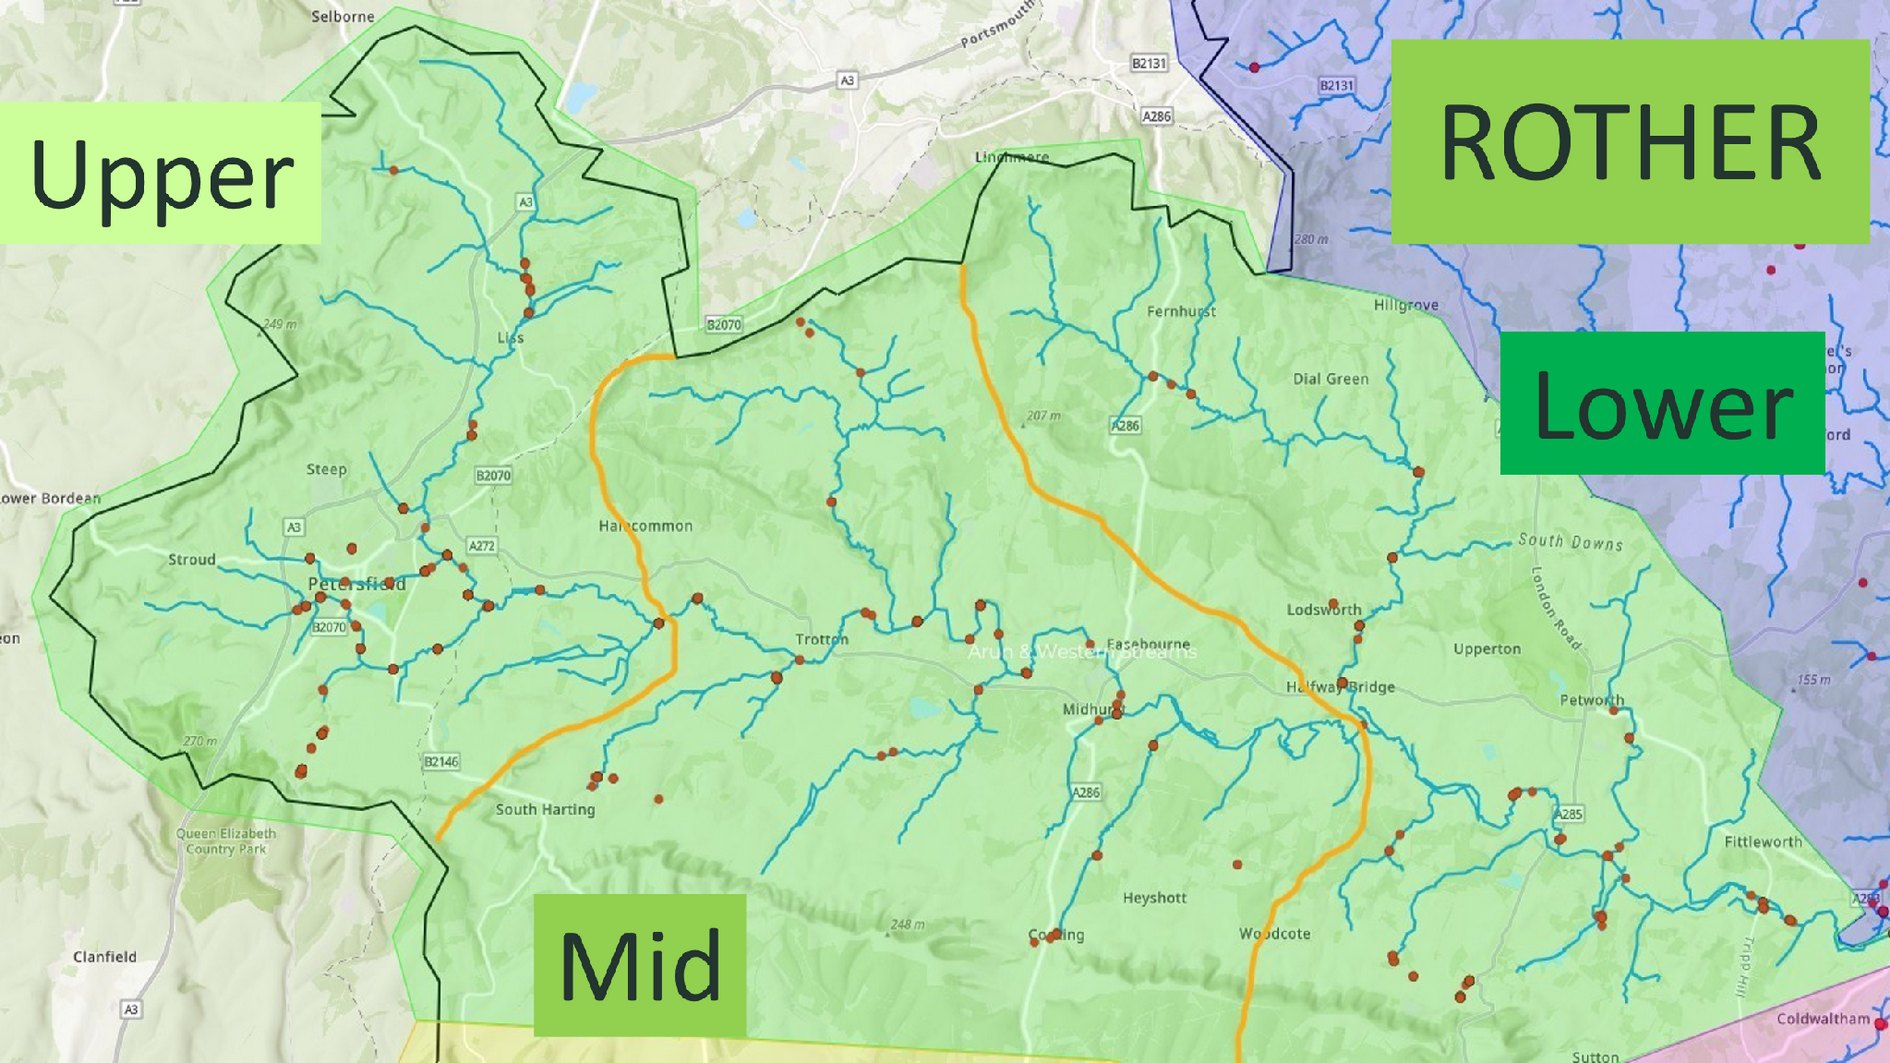
Map and Graphs Courtesy of Western Sussex Rivers Trust
In the following charts the red line corresponds to levels considered Poor, and the orange line is Moderate. Please take a moment to absorb the information in these charts.
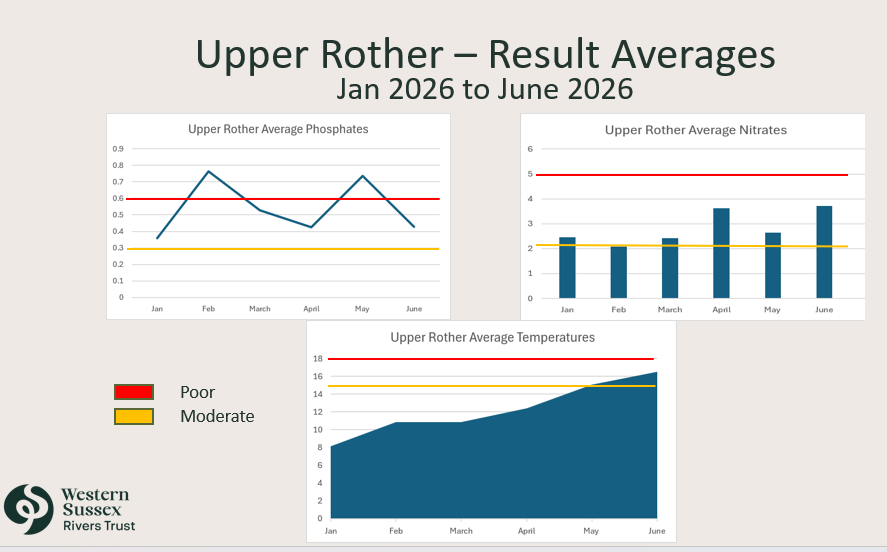
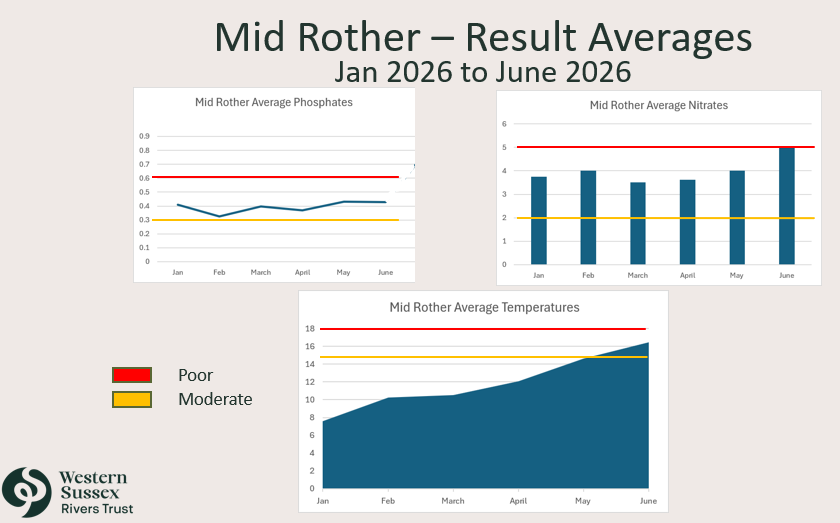
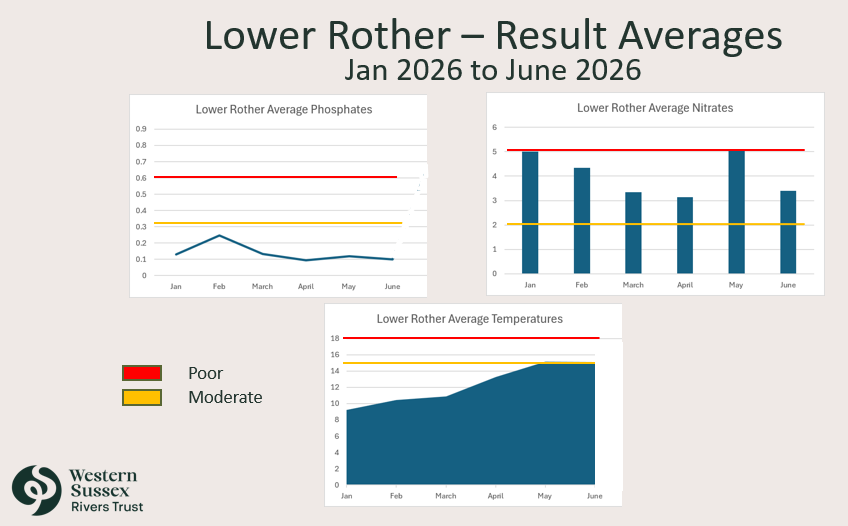
Where Phosphates and Nitrates are both in the unacceptable range it is a recipe for eutrophication (Click on link for definition) and algal blooms, which can prove fatal to life in the river.
Total Dissolved Solids from January to June ranged from 51 to 373ppm, at the time of writing this data was not broken down into monthly totals.
DEFRA Rainfall Data for Petersfield, shows daily rainfall average from March to July, around 3.5mm with notable spikes on the 18 May of 14.6mm, and 1 June of 40.18mm. During periods where there was no significant rainfall to cause soil to run-off into the river from fields and roads, the turbidity measurements were on average reduced.
However, the consequence of lower rainfall is that river levels drop, so any pollutants from Waste Water Treatment Works, septic tanks, road run-off, agricultural run-off etc. are released into a reduced flow, the dilution factor will be significantly reduced and as such pollution will have a greater negative impact on all life forms that come into contact with water in the River Rother.
In summary
Phosphates
Upper Rother and Mid Rother are consistently in the “Moderate/ Poor Range”, however the Lower Rother hovers around the “High/Good Ecological Status Range”.
Nitrates
All three geographical areas show “Elevated Levels” with the Mid and Lower Rother on a heading towards “Excessive”.
The upper and mid Rother regions would definitely benefit from more shading of the river to keep the water temperature below that which endangers life in the water and the riverbed.
Ideally, we would want all results to fall below the orange line on all these graphs, throughout the year – we remain a long way from there!
To draw any further conclusions from this data would require mapping at a more granular level in each geographical area, relating it more closely with rainfall data, waste water discharges, hours of sunshine, land use (i.e. arable, livestock, woodland, nature recovery), ground water levels, and legacy nutrients stored.
ERA’s E.coli testing results are currently being analysed by an M.Sc. student from Portsmouth University, and we plan to bring you their findings in our October ERA talk with a summary in our autumn newsletter with a fuller write up on our blog.
Barry Cooper and Veronica Carter